Tying a claim to the chart it explains
A chart can back a claim, or only sit next to it. Show the reader exactly which mark a claim refers to.
- Problem
- The claim is in the text, the evidence is in the chart, and the reader has to match them.
- Pattern
- Highlight the claiming words, the relevant input value, and the chart mark together.
- Tradeoff
- More to build and maintain. Use it where the chart is the evidence.
A tutorial explanation tied to its chart
Watch what happens when the tutorial mentions first class. The phrase in the narration, the class in the passenger’s details, and the bar showing how class affected the prediction all light up together.
The example comes from my explainable AI explorer, built on the Titanic passenger list. The passenger is a 30-year-old woman in first class who paid an £84 fare. The explorer’s XGBoost model estimates her chance of survival at 99%. The demo uses the explorer’s values with adapted narration and a simplified layout.
What changes
The highlight lets you follow the narration to the corresponding bar without searching the chart. Each bar shows how a detail such as class or age shifts the model’s prediction. These contributions are called SHAP values.
What it doesn't solve
An anchor can still go untested. Showing the mark makes a claim easier to check, but it doesn’t make someone inspect it. A reader can see the connection, take it as proof, and move on without asking whether the highlighted evidence actually supports the claim.
In other products: claims beside charts, with nothing between them
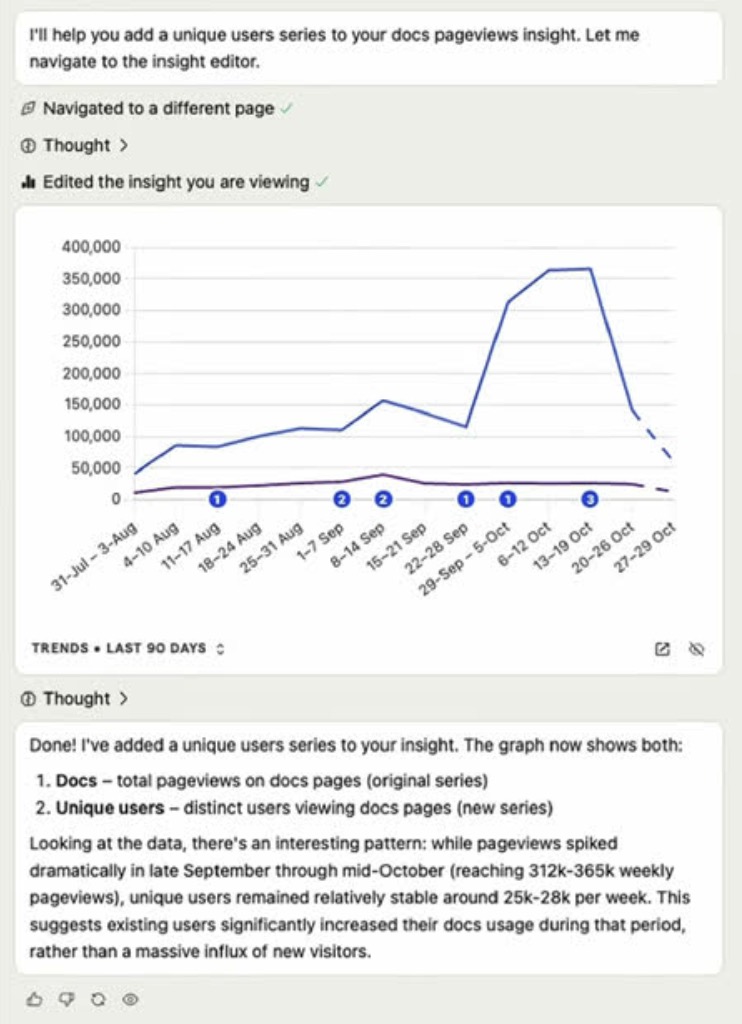
Asked to explain a spike in docs traffic, PostHog AI adds a unique-users line to the chart and writes that pageviews reached "312k-365k weekly" while unique users "remained relatively stable around 25k-28k per week". It concludes that "existing users significantly increased their docs usage".
The chart is right above the claim, and nothing connects them. No number points at the weeks it describes, and the flat line that the whole conclusion rests on fits a few visitors loading many pages just as well.
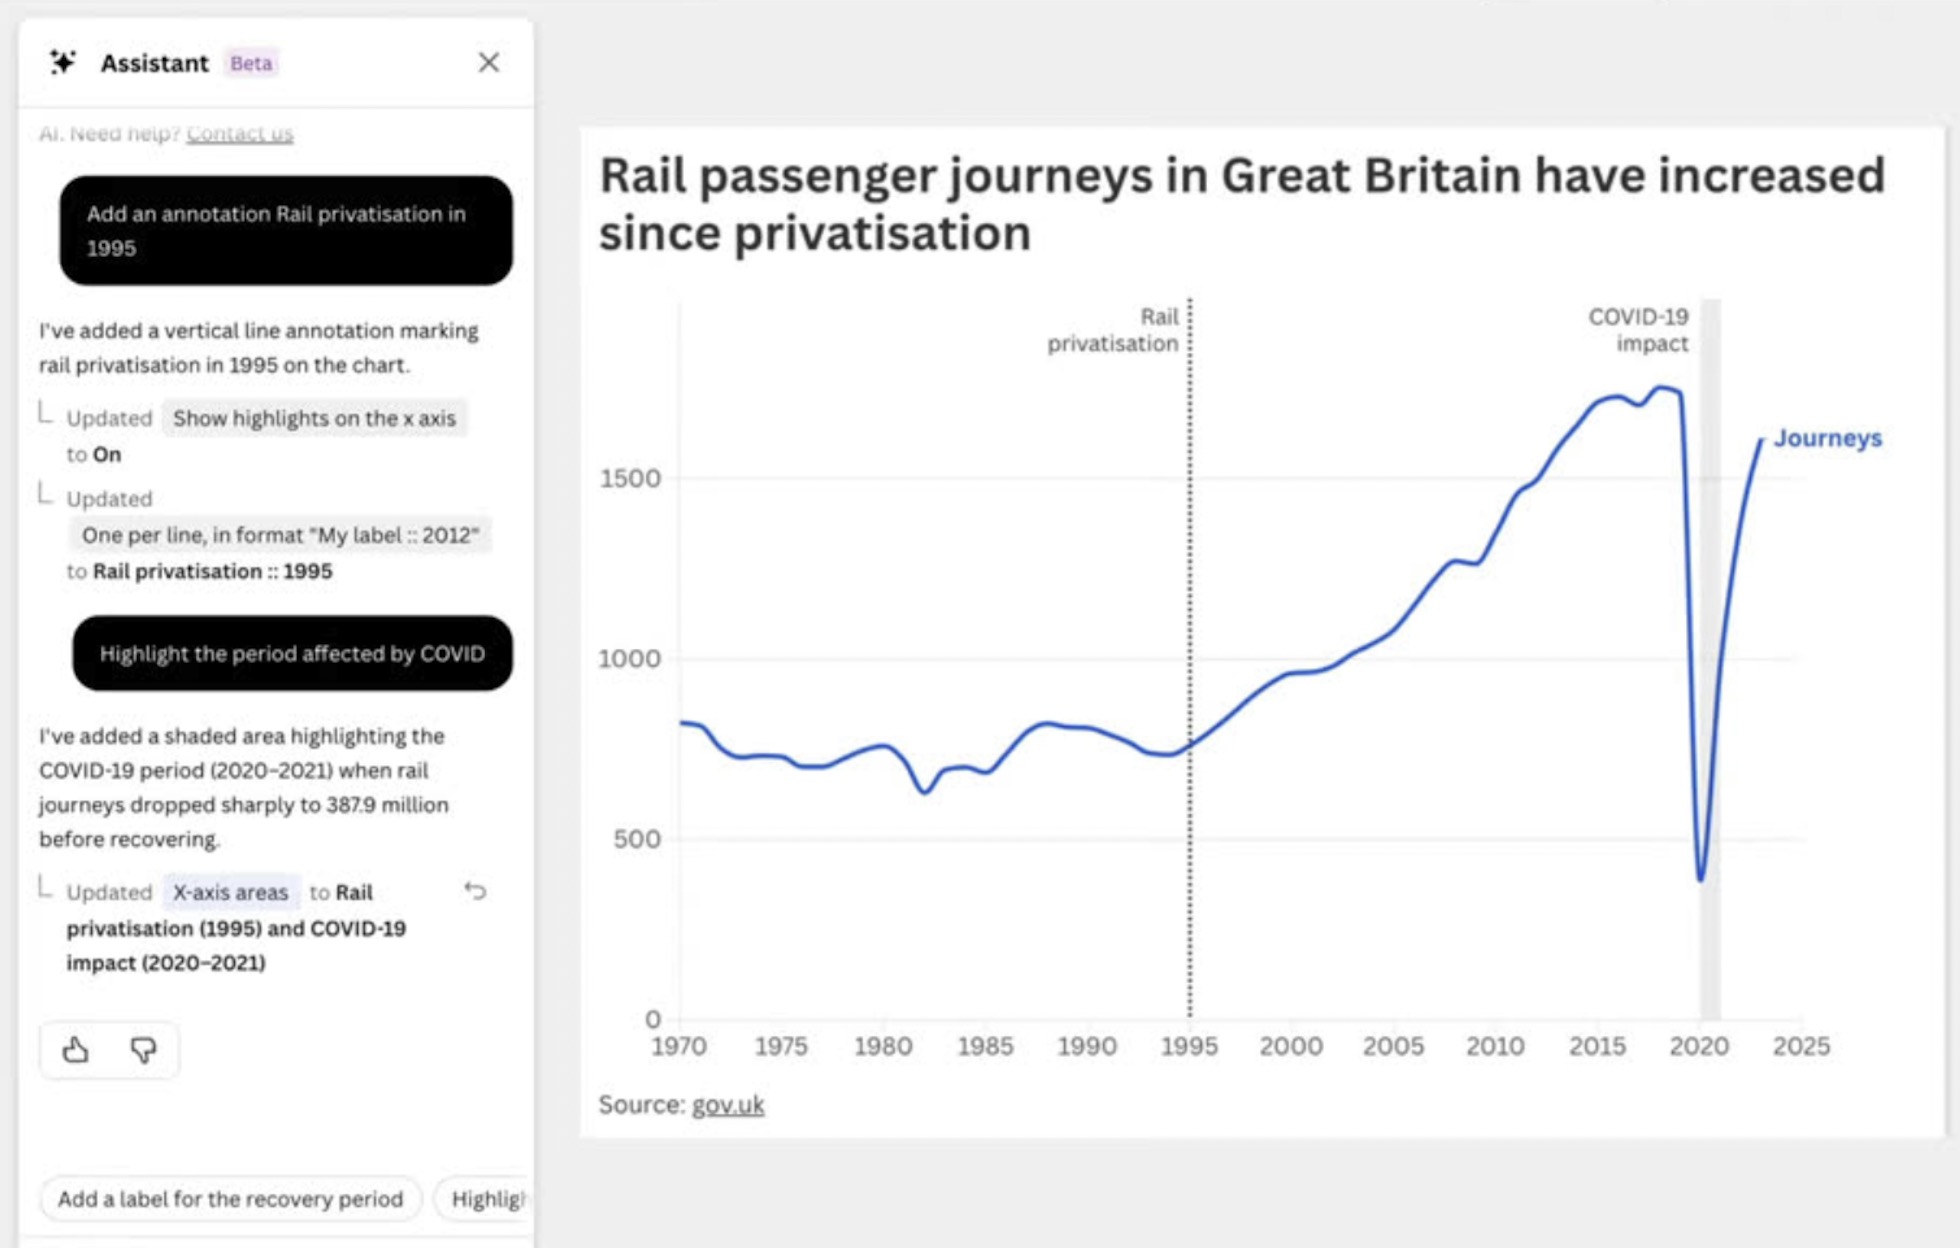
Asked to "highlight the period affected by COVID", Flourish's assistant draws the period onto the chart as a shaded band. The user asked for that connection, so the band anchors the requested COVID period to the chart. The number in the same reply, "dropped sharply to 387.9 million", points at no mark, and the band's dates, 2020–2021, are ones the assistant chose itself.
When to use it
When the chart is the evidence for the decision: an explained prediction, a reported trend, a figure a reader will repeat. For a chart that only illustrates, a caption may be enough.
Where it fails
A highlight lends authority. A lit bar makes a claim look supported even when the bar says something weaker. Flourish's band marks dates the assistant picked itself, and it looks just as certain as the data around it.
The evidence may be unreadable. SHAP values are in log-odds, so the anchor can point at something most readers can't interpret.
Anchoring to the top marks hides the rest. Pointing at the biggest bars quietly drops the small ones. In the demo, fare and age move the prediction too; an unlit contribution can look irrelevant.
Too broad an anchor is no anchor. Lighting the whole chart for a sentence about one bar leaves the reader matching by eye again.